Ruby Gems Download Trends: An Analysis from 2013 to 2023
Analyzing Ruby Gems Download Patterns between 2013 and 2023

Senior Product Engineer, working in Ruby and Rails. Passionate about idea generation, creativity, and programming.
I curate the Short Ruby Newsletter.
While creating the Short Ruby Newsletter I discovered bestgems.org and I noticed there was an interesting graph and would like to discuss it a bit.
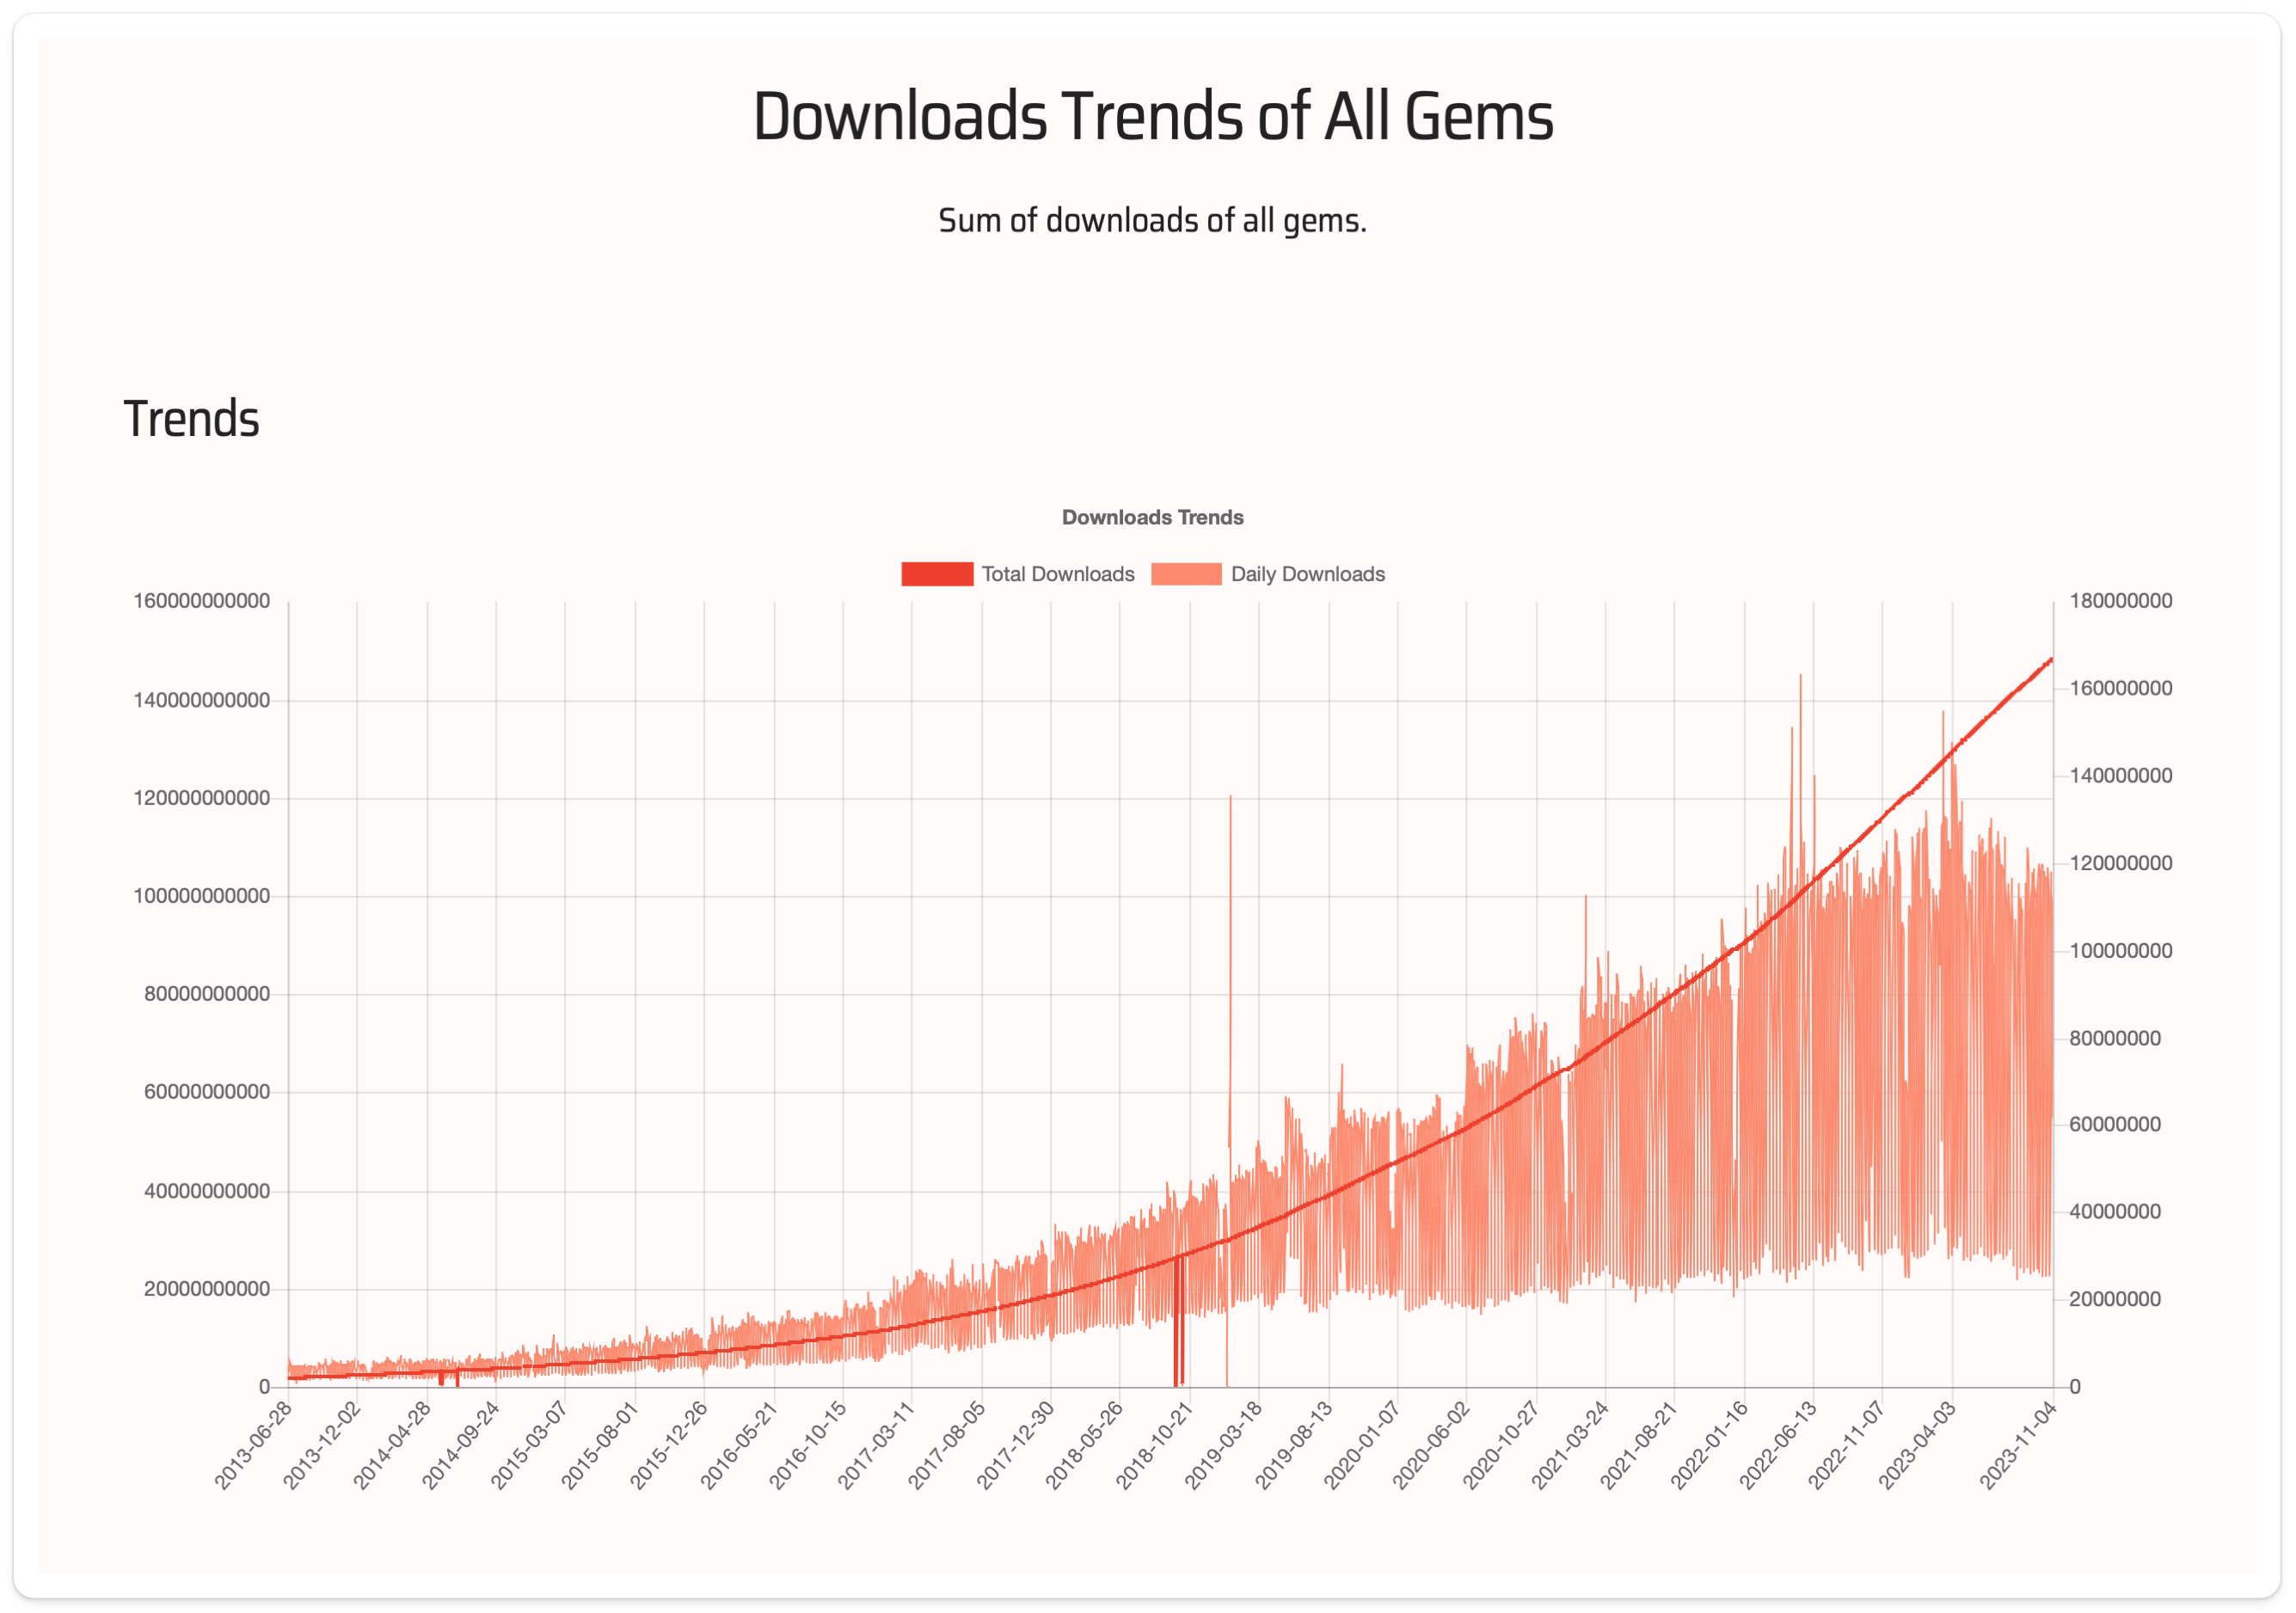
Downloads trends of all gems
Data points
Here is how I read this, first there are two data sets: the total downloads and the daily downloads
Total downloads
It is a sum of downloads of all gems -> so of course this will always be increasing.
But what I think is interesting is how fast the total downloads are increasing. I think it can be seen with the naked eye that starting with say 2019/2020 the total downloads are increasing a lot:
~2B downloads increase from 2013 to 2019
~133 B downloads increase from 2019 to 2023
How do I get to this differences:
1.47B downloads in 2013-07-01 and 3.71B downloads in 2019-07-01 => a difference of about 2.24B
3.71B downloads in 2019-07-01 and 137.53B downloads in 2023-07-01 => a difference of about 133.82B
Conclusion: There are two orders of magnitude increase in the total downloads in the last 4 years versus the previous 5 years.
Daily downloads
If the total downloads are increased of course also daily downloads are increased.
5.75M daily downloads in 2013 (data point taken on 2013-07-03)
50M daily downloads in 2019 (data point taken on 2019-07-03)
127M daily downloads in 2023 (data point taken on 2023-07-11)
Conclusion: the number of downloads per day is more than double, with some periods from 2019 until 2023 with a higher number of downloads per day (like 160M or 154M).
What does this mean?
For sure it means the number of downloaded gems accelerated since 2019.
One explanation could be running tests using CI pipelines and containers so that for every run there is a download of gems.
Some data points:
GitHub launched its Github Actions in 2018 (source)
Gitlab launched its first version of CI in 2012 (source)
Jenkins launched in 2011 (source)
Circle CI launched in 2011 (source)
Travis CI launched in 2011 (source)
Almost 30% of businesses were already using CI/CD in 2013-2014 (source)
I will assume these features took off the next year so it would be 2019 for Github and 2013 for Gitlab and the other major CIs 2012.
It is hard to know if this explanation is the only one. I don't feel it is accounting for all the fast growth since 2019. The only data point that matches that is Github launching their Actions in 2019 but that alone cannot explain the increase of two orders of magnitude since then.
Another explanation could be that Ruby is growing and the pace is increasing. There could be two root causes for this:
More often version updates for gems result in multiple organisations' teams updating
The pace of new projects started is increasing
Again it is hard to know exactly which one is the reality. But I add this explanation that Ruby is growing because I see signs of it also in other places (more conferences, more talk on social media, an increased number of articles, more releases, more jobs, more contacts on Linkedin about jobs ...)
There can be other causes for the increase we have seen since 2019 - maybe the way data is gathered changed, it is more granular or better captured.
I think it is a combination of both explanations - CI being adopted on a large scale while also the Ruby number of projects growing more rapidly in the last 3-4 years.
Data validation
bestgems.org is not rubygems.org and I could not yet find how they are taking their data.
Still, when looking at the total number of downloads (see the comparison image below), it seems to have the same data so I wrote this article starting with the assumption that bestgems.org data is valid.
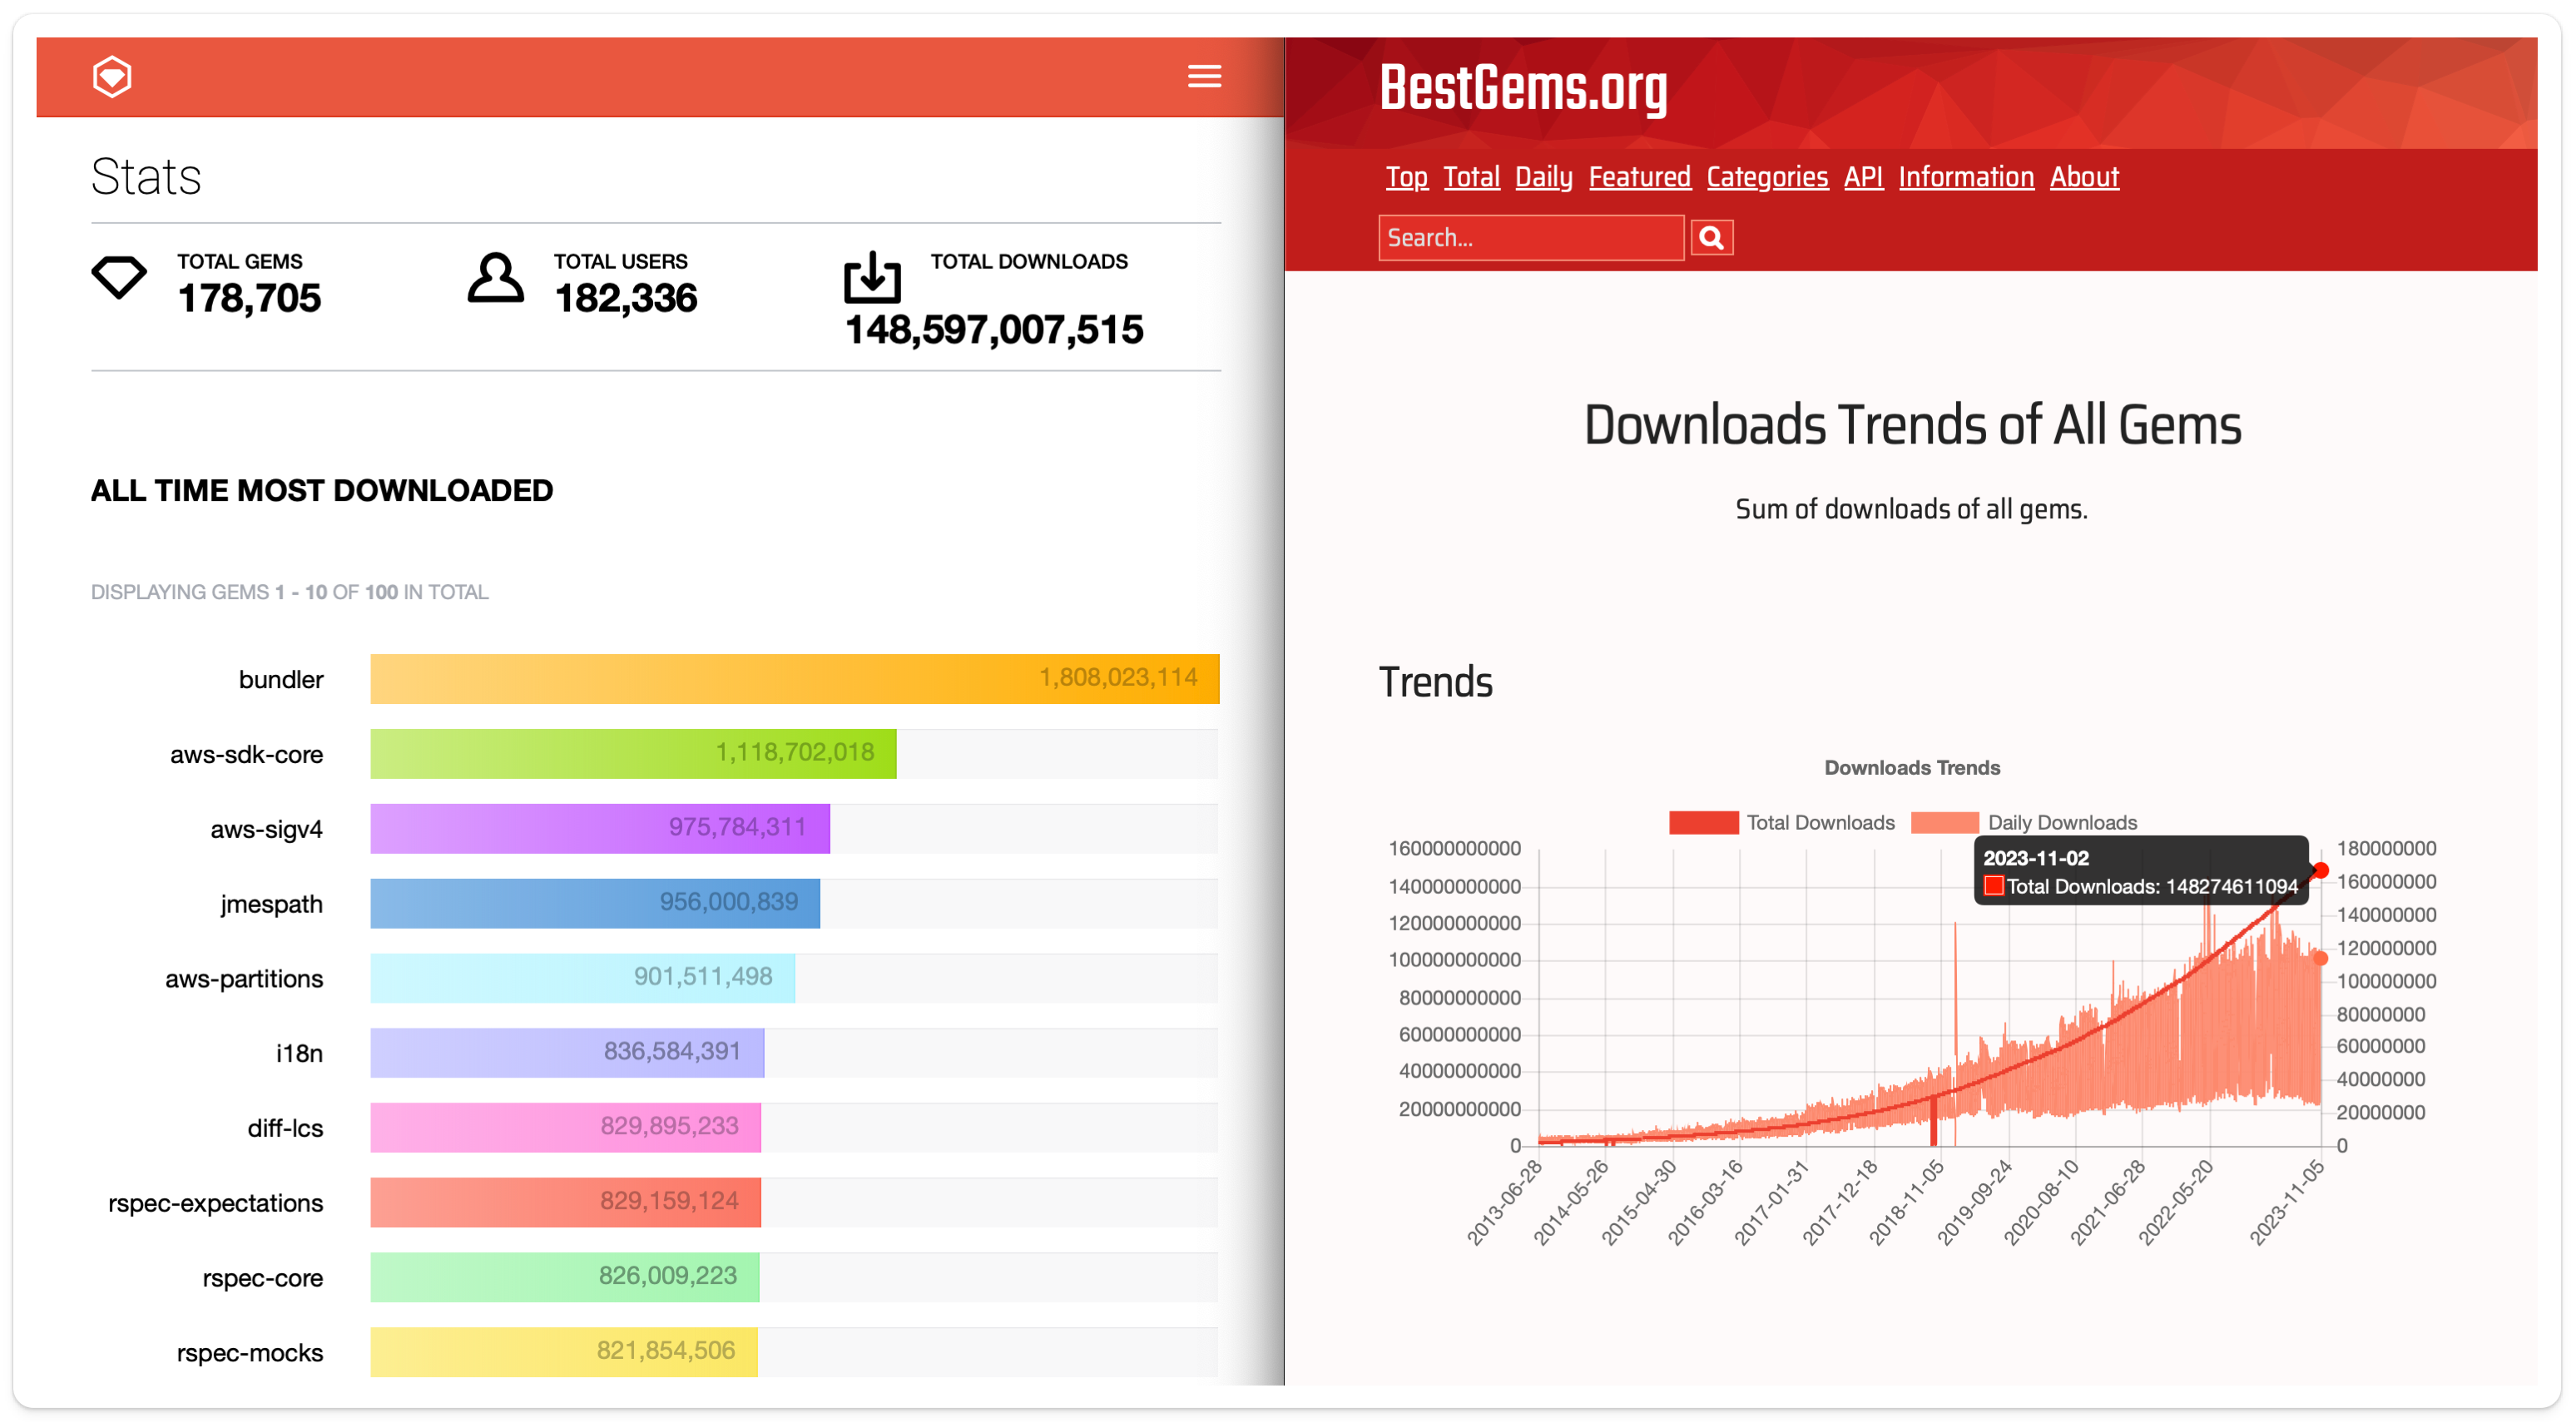
(left) https://rubygems.org/stats vs (right) https://bestgems.org/stat/downloads
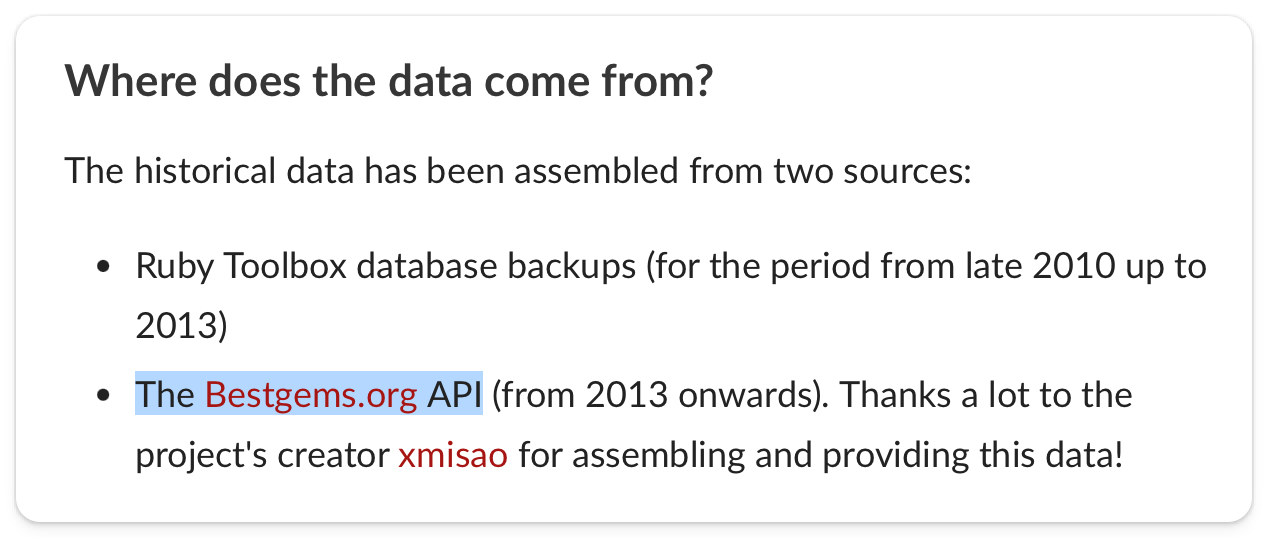
On another side, ruby-toolbox.com is using bestgems.org as a data source:
Maybe a conclusion
The rapid increase in Ruby gem downloads since 2019 can be attributed to the widespread adoption of CI/CD pipelines (with a small note that a lot of CI/CD tools were launched years before) and also to the growing popularity of Ruby in new projects.
This trend reflects the growing importance of Ruby in the software development ecosystem.
Enjoyed this article?
👉 Join my Short Ruby News newsletter for weekly Ruby updates from the community and visit rubyandrails.info, a directory with learning content about Ruby.
👐 Subscribe to my Ruby and Ruby on rails courses over email at learn.shortruby.com - effortless learning anytime, anywhere
🤝 Let's connect on Ruby.social or Linkedin or Twitter where I post mainly about Ruby and Rails.
🎥 Follow me on my YouTube channel for short videos about Ruby